Visual analysis of fitness landscapes in architectural design optimization
 Image credit: [Kuno Kurzhals]
Abstract
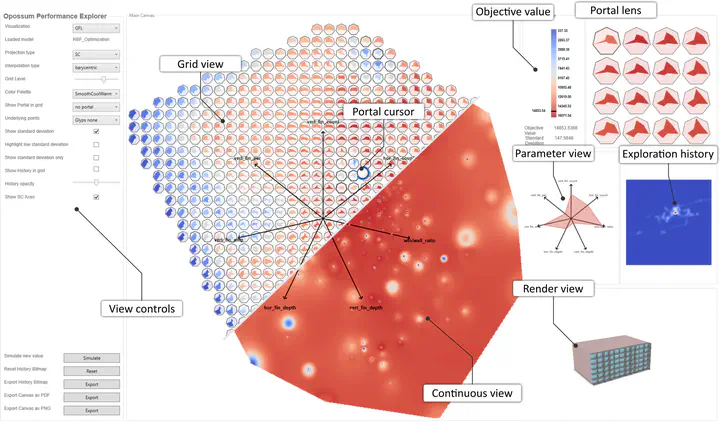
In architectural design optimization, fitness landscapes are used to visualize design space parameters in relation to one or more objective functions for which they are being optimized. In our design study with domain experts, we developed a visual analytics framework for exploring and analyzing fitness landscapes spanning data, projection, and visualization layers. Within the data layer, we employ two surrogate models and three sampling strategies to efficiently generate a wide array of landscapes. On the projection layer, we use star coordinates and UMAP as two alternative methods for obtaining a 2D embedding of the design space. Our interactive user interface can visualize fitness landscapes as a continuous density map or a discrete glyph-based map. We investigate the influence of surrogate models and sampling strategies on the resulting fitness landscapes in a parameter study. Additionally, we present findings from a user study (N = 12), revealing how experts’ preferences regarding projection methods and visual representations may be influenced by their level of expertise, characteristics of the techniques, and the specific task at hand. Furthermore, we demonstrate the usability and usefulness of our framework by a case study from the architecture domain, involving one domain expert.