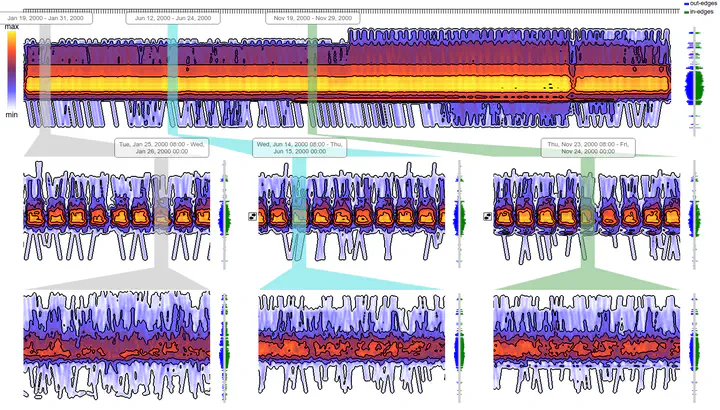
 A multi-timescale view on a dynamic graph dataset acquired from the US domestic flight database consisting of several hundred vertices (airports), several million edges (flight connections), and more than one million time steps (from January 1st, 2000 to December 31st, 2001). Three levels from top to bottom represent monthly, daily, and hourly patterns, respectively
Abstract
Dynamic graphs build complex data structures composed of vertices, edges, and time steps. Visualizing these evolving structures is a challenging task when we are not only interested in the dynamics based on a fixed time granularity, but also in exploring the subsequences at multiple of those time granularities. In this thesis, we introduce a multi-timescale dynamic graph visualization. The dynamic graph is displayed with interleaved parallel edge splatting focusing on visual scalability to generate an overview of dynamic graph patterns first. Different time scales can then be displayed in a vertically stacked scale-to-space mapping showing finer time granularities in linked side-by-side views, which is in particular useful for comparison tasks. To obtain an uncluttered view of the evolving graph patterns, the data is first preprocessed by clustering and vertex ordering techniques. It is then plotted in a 1D bipartite layout, splatted, smoothed, and enhanced with contour lines for perceptual augmentation. Inner- and inter-scale comparisons are supported visually and algorithmically.