Exploring the Design Space of Fiber Structures

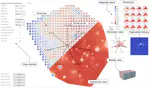
In collaboration with experts from the architecture domain, we designed and built FiberVis, a tool for exploring the simulation results of coreless filament wound structures (CFW). Figure 1 shows some of the visualizations we implemented. Parallel coordinates plots and scatter plot matrices provide an overview of the solution space. Small multiples representations together with the line- and column-chart enable the comparison between the candidate solutions. For more information please read the full article.
Used Tech : C#, .NET, WPF, Rhino/Grasshopper, SciChart
Moataz Abdelaal
Research Scientist (He/Him)
My research interests include network visualization, Visual Analytics, and Human-Computer Interaction.