Timber Stakeholders Explorer

Figure 1: Projects Network. Projects are represented as ring nodes. Flags indicate stakeholder headquarters locations. Colored dots represent stakeholder types.

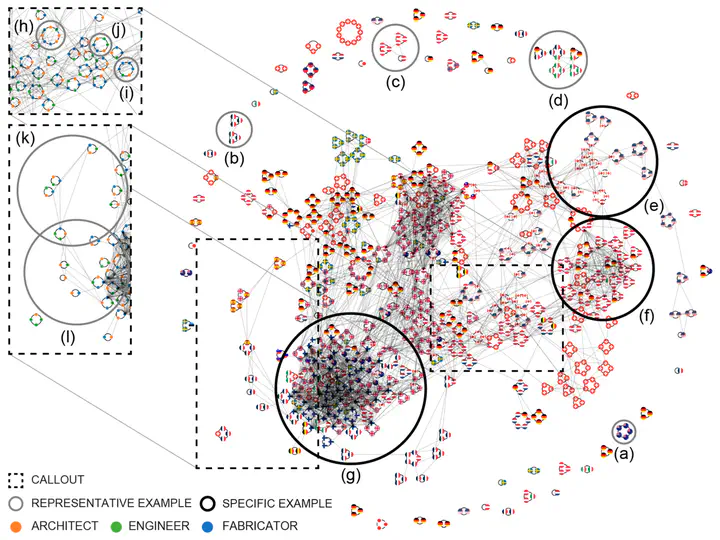
In this project, we took on the task of designing and building an interactive web interface to explore and analyze the stakeholder network of the multi-storey timber design and construction sector. We provide two interactive ways of visualizing the stakeholders network: either as a node-link diagram with different encoding options, as seen in Figures 1 and 2, or as an interactive geographical map, as seen in Figure 3. A live prototype can be found here.

This interface was used by our collaborators to answer qualitative questions about the connection between architectural variety in timber construction and the stakeholders involved. Please read our paper for mere details.

Figure 2: Timber Stakeholders Explorer user interface. (a) Graph controls, including Graph Type, Graph Settings, Filtering, and empty Info Panel. (b) Info Panel showing example stakeholder information. (c) Info Panel showing example project information. (d) Stakeholder node with Ring Connectors. (e) Stakeholder node without Ring Connectors. (f) Stakeholder node with Label. (g) Stakeholder node without Label. (h) example Project cluster with Links. (i) example Project cluster without Links. (j) SCN without Contours. (k) SCN with Contours. (l) Stakeholders GeoMap without Color by Stakeholder Type. (m) Stakeholders GeoMap with Color by Stakeholder Type. (n) Stakeholder Encoding by Type. (o) Stakeholder Encoding by Country. (p) Stakeholder Encoding Both (Type and Country).
Figure 3: Map of stakeholder locations. Dots represent cities where at least one stakeholder is headquartered.

Used Tech : D3.js, leaflet, Javascript, HTML, CSS

Moataz Abdelaal
Moataz Abdelaal
Research Scientist (He/Him)

My research interests include network visualization, Visual Analytics, and Human-Computer Interaction.