Hello!
Welcome to my website! My name is Moataz. I am a research scientist at the Visualization Research Center (VISUS) at the University of Stuttgart, Germany. Currently, I am working towards my PhD degree in data visualization. My research interests include designing scalable techniques for visualizing dynamic networks and building tools to help architects in shaping our future built world. During my PhD, I built various visualization prototypes using various technology stacks, including D3.js-JavaScript, C#-WPF, Java-Servlets, and, more recently, TypeScript-Angular. In the past, I have worked professionally as a Java and .NET developer. When I’m not working, I enjoy traveling, hiking, watching movies, playing sports, or catching up on some sleep :) Here, you will find some information about me and my little research projects. I will try to keep things up to date!
- Visualization
- Network Visualization
- Empirical User Evaluation
- Visualization Tools
MSc in Computer Science, 2017
University of Stuttgart, Germany
BSc in Software Engineering, 2010
Helwan University, Egypt
Experience
Conducting scientific research in the field of data visualization, particularly focusing on designing, developing, and evaluating techniques for network visualization and building interactive tools to support architects exploring the design space within the context of cluster of excellence (IntCDC). Responsibilities include:
- Reviewing the state-of-the-art
- Identifying research gaps and formulating research questions
- Cocenptualization and desiging visualization solution
- Implementing and Prototyping
- Testing and evaluation
- Writing and presentation of the results
- Tutoring and thesis supervison
Optimizing the performance of the company’s web-based e-commerce system. Responsibilities include:
- Integrating multithreading functionality
- Developing new features
- Fixing bugs
- Used Technology: ASP.NET, C#, HTML, Javascript, SQL Server 2012
Develpoing and maintaining the company’s LMS (Tadarus). Responsibilities include:
- Developing new features
- Fixing bugs
- Supporting the clients
- Used Technology: Java, Servlets and JSP, SQL Server 2005
Research Projects
C#, .NET, WPF, Rhino/Grasshopper, SciChart
C#, .NET, WPF, Rhino/Grasshopper
D3.js, leaflet, Javascript, HTML, CSS
R, HTML, JavaScript, D3.js, jsPsych, PHP, MySQL
R, Java, Servlets, HTML, JavaScript, D3.js, SVG, Canvas
Featured Publications
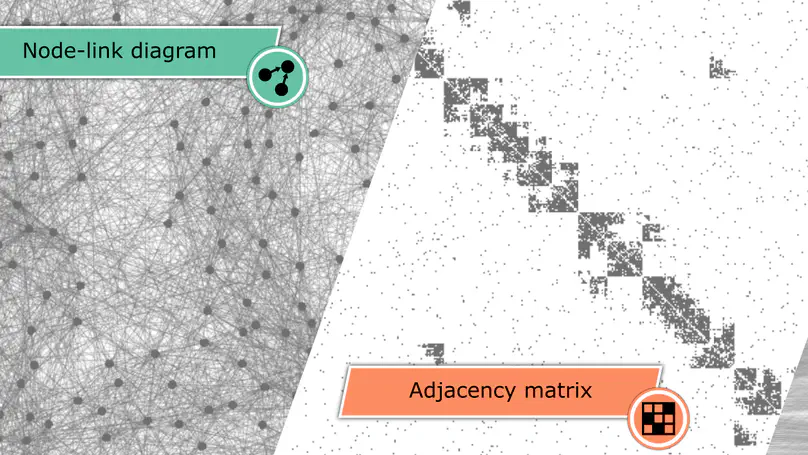
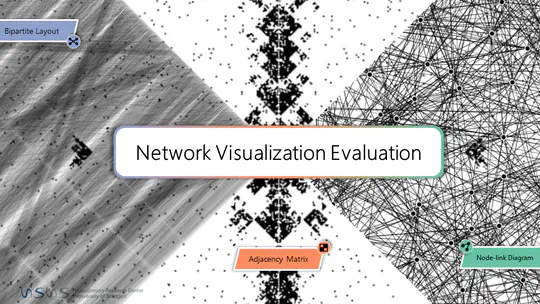
This work investigates and compares the performance of node-link diagrams, adjacency matrices, and bipartite layouts for visualizing networks. In a crowd-sourced user study (n = 150), we measure the task accuracy and completion time of the three representations for different network classes and properties. In contrast to the literature, which covers mostly topology-based tasks (e.g., path finding) in small datasets, we mainly focus on overview tasks for large and directed networks. We consider three overview tasks on networks with 500 nodes: (T1) network class identification, (T2) cluster detection, and (T3) network density estimation, and two detailed tasks: (T4) node in-degree vs. out-degree and (T5) representation mapping, on networks with 50 and 20 nodes, respectively. Our results show that bipartite layouts are beneficial for revealing the overall network structure, while adjacency matrices are most reliable across the different tasks.
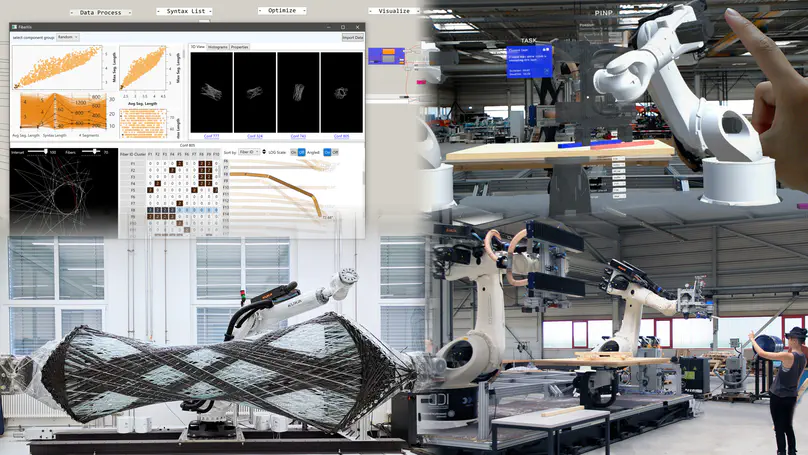
Our built world is one of the most important factors for a livable future, accounting for massive impact on resource and energy use, as well as climate change, but also the social and economic aspects that come with population growth. The architecture, engineering, and construction industry is facing the challenge that it needs to substantially increase its productivity, let alone the quality of buildings of the future. In this article, we discuss these challenges in more detail, focusing on how digitization can facilitate this transformation of the industry, and link them to opportunities for visualization and augmented reality research. We illustrate solution strategies for advanced building systems based on wood and fiber.
Recent Publications
Popular Topics
Tutoring and Supervision
Information Visualization
University of Stuttgart, Germnay
Scientific Visualization
University of Stuttgart, Germnay
Theoretical Foundations of Visual Computing
University of Stuttgart, Germnay
Image Synthesis
University of Stuttgart, Germnay
Seminar on Visualization of Graphs and Networks
University of Stuttgart, Germnay
Sebastian Grund, MS Thesis, 2023
Visual Parameters Space Analysis for Architectural Design Space Exploration.
Contact
- moataz.abdelaal [at] visus.uni-stuttgart [dot] de; mottazabdelfattah [at] gmail [dot] com
- +49 711 685 88616
- Allmandring 19, Stuttgart, BW 70569
- Room 00.010
